


HOW TO USE FINANCIAL ASTROLOGY TO INCREASE THE ODDS OF BEATING THE MARKET ?
rosecast free newsletter from october 28, 2011
How to Combine "Street Smarts" with Financial Astrology to Increase the Probability of Beating the Odds
In this Rosecast.com newsletter we will explore how we can combine financial astrology with "street smarts" in order to increase our odds of beating the market.
We will disocver that if there exists a way of "increasing the odds with financial astrology ", there must naturally exist a way of "decreasing the odds with financial astrology". We will look at both ways and then draw our conclusions.
At Rosecast.com we have recently developped in interest into fully automated trading robots that use astrological data as a critical component to improve system performance.
What we have already learned from this matter I want to exclusively share with you in this edition of our free newsletter.
First when developing a system you want to decide on the time frame. Do you want to look at 1 minute bars, 15 minute bars, hourly bars, daily bars or weekly bars or any other particular time frame ?
For the discussion here we will only look at daily bars. The reason is twofold. Many astrological forecasting tools (like the Rosecast Bradley software, our own Moving Stars and the 2011 Annual Forecast Book) are designed to forecast a particular day in advance.
Most of you look at the stock market when you come home from work. That means you will look at the market's CLOSE on any given day. 80% of the time the closing price of the prior trading day will equal the opening price of the next trading day or the difference will be very small. Most poeple that do work regular jobs think that they are at a disadvantage when playing the stock market, because they do not have the time to watch and trade the market all day.
But from a system perspective that is certainly NOT true. A system that trades on daily bars CANNOT look at hourly bars or smaller time frames EITHER. A system could only buy the low or sell the high on a particular day, if there was a known condition - like a Fibonacci level - that pinpointed a particular price as that high or low.
During the last year I have worked a lot on smaller time frames like hourly charts or even X minutes charts (X ranges between 1 to 15). I looked at the astrological conditions that were neccessary in order to pinpoint a swing low or a swing high towards an exact hour or minute. What I have realized is that knowing the astrological cause of a minute low or an hourly low is not helpful in making a decision that concerns the future of the daily bars. Instead I have suffered from an overflow of information.
My first conclusion of this discussion is that once you have made a decision to trade the Daily Bars you will NOT gain any notable advantage by looking at smaller time frames. You can however gain an advantage by looking at larger time frames...like weekly and monthly charts.
Working with trading systems I have come to the conclusion that the best time of execution is often the close of a bar. The reason is that by trading only at the close of a bar the system will filter out a lot of noise that arises from trading before the bar closes.
For the reminder of this discussion we will therefore assume the following. We can only look and trade the market after the close (next day opening ) of the day. We use astrological inputs like the Rosecast Bradley software or the 2011 Annual Forecast Book in identifying those days that render a high probabilty of a market turn.
It is now time to look at a particular example. On October 3, 2011 the S&P 500 has closed at 1099 , the Dow Jones has closed at 10650. These have been the lowest closes of those indices during the year 2011. Has there been any astrological condition that October 3 stands out as a very important day. ?
Yes, indeed. One very important aspect that became most exact on October 3 was a parralel aspect beween Saturn and Chiron in declination.
With the "Moving Stars 24-hours Exact Feature" the same aspect is never counted twice on two days, but always pinpointed towards an exact day. I have designed this feature for beginners of financial astrology that are not familiar with the concept of orb. WITHOUT THE 24 HOUR EXACT-FEATURE beginners of financial astrology would have a hard time to first spot an astrological aspect and to later pinpoint it to a certain day.
The 24-hour EXACT feature tells us that that a lot of important aspects have been exact on October 3.
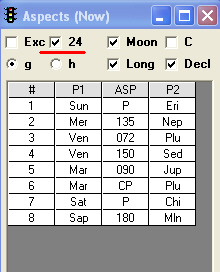
Screenshot of Moving Stars 24 HOUR Exact Feature for October 3, 12 pm, Eastern Time (New York).
Other than Saturn parralel to Chiron, Mars was 90 degrees to Jupiter and contra-parralel to Pluto, Mercury was 135 degrees to Neptune and the asteroid Sappho, the darling of those astrologers that are fans of the Magi Society was 180 degrees to the Mean Lunar Node. Notice that 180, 90 and 135 are all "bad" aspects in traditional astrology. Notice that Mercury, Mars, Sappho and the Mean Node are all traditional negatively rated astrological factors. For example the Magi Society claims that Sappho rules greed, fear and neurotic behaviour. Indian astrologers claim that the Mean Lunar Node is a bad influence in the horoscope and call it the "The Dragon's Tail." Mars is called the "second malefic planet" in traditional astrology.
Also here at Rosecast.com we have forecasted October 3 as a likely bottom in our Classic Newsletter that is usually released two to three times per week.
Given all these factors we could have come to the conclusion that October 3 is really the most likely day f the market to make an important low.
But does this mean we should buy the market on October 3 close ?
While IN HINDSIGHT October 3 was the lowest close of the year, if you have bought the market on October 3 close....you would certainly have experienced CONSIDERABLE FEAR on October 4. The reason is that most of the time the S&P 500 was trading below the closing price of October 3 on October 4.
Imagine we come home from work 45 minutes before the close of October 4 and we watch CNBC and see that the S&P 500 is quoted at 1079...and we think..."another down-day"...but then we look at the S&P 500 Index 45 minutes later and we can hardly believe that it has closed at 1124. My point here is that it really does not matter how price trades during the day. The only thing that counts is where price has closed on any given trading day.
So looking at the market after its October 4 close you could draw the conclusion that the market action has confirmed October 3 as a potentially important swing low for the S&P 500 Index.
There are several exact technical conditions that you can use for confirmation of an "ASTROLOGICAL SETUP DAY/BAR".
Notice that October 3 in our discussion above is an "ASTROLOGICAL SETUP DAY". the reasons is that according to the 24 hour exact feature - many aspects have been exact on October 3. In order for the ASTROLOGICAL SETUP DAY to trigger a BUY/SELL signal, we must need a CONFIRMATION BAR on the next BAR or on one of the next BARS/DAYS that confirms our condition of an "ASTROLOGICAL SETUP".
Below I make several proposals for a confirmation condition:
1) The market must close higher/lower on day X+1 than on day X in order to trigger a LONG/SHORT signal.
2) The market must close a certain amounts of points higher/lower on day X+1 as on day X.
3) The market must close above the HIGH or LOW of the ASTROLOGICAL SETUP BAR on day X+1 or X+x.
4) The condition that I prefer to use is the following. It is exclusively shared with you in this newsletter. In order to trigger a BUY/SELL signal we want the market to close above/below the Average Open/Close Range of the ASTRO - SETUP DAY. For example: On October 3 the S&P 500 opened at 1131 and closed at 1099. The Average of the Open-Close range is thus 1115 ((1131+1099)/2). Since the close of 1124 on October 4 is higher than 1115 the condition has been confirmed and we can enter the market on the LONG side on the close of October 4 or on the opening of October 5.
We can put a stop loss below 1115 or the close/low of October 3 on a closing price basis. That means once the market closes below 1115 we would be stopped out with our LONG from 1124. We could apply the stop loss on a close-only basis or on an intraday-basis. This depends on our risk tolerance. My point here is that any trading system will have some kind of a STOP LOSS condition that tells the system when it is best to exit the market with a loss.
Therefore we also should think about a stop loss before we use astrological factors as an input in our decision-making process.
Noticed that while IN HINDSIGHT the October 3 close provided a better entry to go LONG than the October 4 close, from a RISK (RISK is defined as the probability of losing on a trade) PERSPECTIVE October 4 was a better entry, because only on his day "price action" has confirmed our astrological analysis.
To contribute another example towards this discussion I will use our own 2011 Annual Forecast Book. In the 2011 Annual Forecast Book, written in December of 2010, we have forecasted April 29, 2011 and October 12, 2011 as the two most important potential days for a high in the stock market in 2011 .
On April 29, 2011 the S&P 500 has closed at 1363, its highest close of the year 2011.
On this day there was a Rosecast Trispect (in this case a triple conjunction) between the planets Eris, Jupiter and Mars. This is one of the astrological reasons why April 29 has been forecasted as one of the two most important highs in 2011.
Question: Since Markus Rose is a very knowledgeable financial astrologer and since he forecasted this day already in December of 2010, does this mean that you act "street smart", if you sell the S&P 500 Index on April 29, 2011 ?
Answer: One could say that the answer to this question depends on your faith in Markus Rose.-). While in hindsight it certainly looks like the right thing to do, from a risk ("street smart") perspective May 2 (1361) or even May 3 (1356) are better entries.
On May 2 the S&P 500 Index has closed below the high of the average Open/Close range of April 29 (see confirmation condition # 4 above as 1361.2 is lower than 1361.5). Price action has thus confirmed one of our confirmation rules. In summary the probability of a winning trade is much higher on May 2 than on April 29.
Let's turn now to the second forecasted date of October 12, 2011
In the week before October 12 the S&P 500 Index has rallied 130 points (from its October 3 low of 1074) or almost 10 percent. It was one of the most violent bull rallies in 2011. So once again the secrets that we have revealed in the 2011Annual Book did a great job and caused one of the biggest rallies of the year - the power of financial astrology is undeniable.
Question: Since Markus Rose is a very knowledgeable financial astrologer and since he forecasted this day already in December of 2010, does this mean that you act "street smart", if you sell the S&P 500 Index on October 12, 2011 ?
Answer: As we have already concluded above - we can increase the odds of winning if we wait for confirmation from price action.On October 13 the market has closed at 1203 - above the average OC range of October 12. Price action has therefore declined a confirmation for selling the market.
On October 14 the S&P 500 has closed at 1224. Since 1224 is higher than the high of October 12 we can conclude that price action has negated October 12 to be a valid astrological setup bar for a SWING HIGH in the S&P 500 Index. Therefore we can assume that the market will likely continue to rally - which it did.
Conclusion: By waiting for confirmation from price action we would have given up two points on our April 29, 2011 forecasted high.
At the same time we would have avoided a losing trade on October 12, 2011. Overall we improve our results and our probabilty of beating the markets with financial astrology, if we wait for confirmation from price action.
SUMMARY: While we will NEVER catch the exact HIGH or LOW when waiting for confirmation, we will avoid many losses and thus increase our overall probability of being the market when combining astrology with "Street Smarts". In other words we act "street smart" when we NOT try to sell the highest high or buy the lowest low. Instead we will wait for confirmation from price action before taking on market risk.
If you are interested in learning more about the astrological conditions that cause important highs and lows, then be informed that we offer a special mentoring program. The astrological factors you will discover with our help and our software will alert you long ahead of time about the most important turning points in the future.
We hope that you can employ the information in this free newsletter to increase your odds of beating the market.
With heavenly regards,
http://www.rosecast.com
Ranked #1 Stock Market Timer
10/10/2007 to 10/10/2008 by Timer Digest
Ranked #1 Gold Timer of 2008 by Timer Digest