


THE CRASH OF AUGUST 2011
Rosecast Newsletter August 11, 2011
The Crash of August 2011
August 4 and August 8, 2011 will long be remembered. On these days the S&P 500 has dropped 60 points and 80 points respectively.
On the Flash Crash of May 6, 2011 the S&P 500 has closed down about 40 points "ONLY", recovering from being down 100 point during the intraday session.
So on both August 4 and August 8 the drop was more significant than on the day of the FLASH CRASH.
The "Crash of August 2011" is the period between August 4 and August 8 or August 4 and August 10 - dependent on your preferences.
Even during the financial crisis (that started with the All Time High of October 11, 2007 in the S&P 500 Index and ended with the lowest low on March 6, 2009) there have only been a few days on which the S&P 500 has dropped in a similar fashion.
For serious researchers of financial astrology I have compiled a list of the worst down-days during the financial crisis 2007-2009 below.
October 11, 2007: S&P 500 hits all-time high of 1576 points
November 1, 2007: -40 points
November 7, 2007: -50 points
December 11, 2007: -50 points
January 4, 2008: -40 points
January 17, 2008: - 40 points
February 5, 2008: -40 points
February 29, 2008: -40 points
June 6, 2008: - 40 points
June 26, 2008: - 40 points
September 4, 2008: -40 points
September 17, 2008: -50 points
September 29, 2008: -100 points
October 2, 2008: -50 points
October 6, 2008: -40 points
October 7, 2008: -60 points
October 9, 2008: -80 points
October 15, 2008: -90 points
October 22, 2008: - 60 points
November 5, 2008: - 50 points
November 6, 2008: -50 points
November 12, 2008: - 50 points
November 19, 2008: - 50 points
November 20, 2008: - 50 points
December 1, 2008: - 80 points
January 20, 2009: - 50 points
February 10, 2009: - 40 points
February 17, 2009: - 40 points
March 2, 2009: - 40 points
March 5, 2009: - 30 points
March 6, 2009: market hits low of 666 points (markets 909.3 points lower than at October 11 high)
Figure 1: List of days with highest single point losses in S&P 500 between "All Time High and Low of the Decade"
So what was the reason behind the crash days of August 4, 8 and 10 and can the answer be found in the stars ?
At Rosecast we believe that the answer to all big events - and that includes Financial Crashes - can be found in the stars.
But I also want to say that I have NOT forecasted August 4 and August 8 as "Bad Days" for the market. I have however forecasted August 10 as a "BAD DAY" and on this day the S&P 500 has closed down 50 points. The forecast for August 10 was already made during the end of July and was reiterated on August 8. Also on August 8 I have forecasted that August 9 would be a strong day UP - and indeed it was. It was the biggest UP-DAY of the year 2011 in the S&P 500 Index.
When I woke up in the morning of August 8 I was already "feeling" the negative energy of this day. And although I have analyzed on the weekend that August 5 is a potential bottom, once I woke up on August 8 - I saw and felt "the writing on the wall". After the close of August 8, I have asked myself: "What have I been missing in my astrological analysis ?" This has lead me to a great new discovery. I am kind of lucky that I have made this discovery on August 8, because I know that WD Gann has also made a great discovery on August 8, 1908 - this was 103 years ago - my source of Gann's discovery is the book "Supertiming" from Myles Wilson Walker.
I want to reserve the ramifications of this discovery for my advanced "financial astrology mentoring students", but I want to say that much here: The reason for investors to sell out on days when the S&P 500 Index drops more than 40 points - is not greed - and is probably not fear - although fear can be a factor - it is complete hopelessness. Once all hope is gone, there is nothing left to do- except quitting. Fear can stimulate us - when we have fear our body produces adrenalin and we are motivated - but when all hope is gone - there is nothing left to do. That is why during the Great Crash of 1929 some investors have committed suicide - not because of fear - but because they have lost all hope.
Now on Monday evening I have learned from a reliable source that some traders on the floor of a big Investment Bank in London just left their desks during work hours and went straight to the pub. When they came back after a few hours they were in a different state - but that state would surely prevent them from DRIVING home that night - enough said. So when all hope is gone - there is nothing left to do - except quitting or selling out. So my discovery is the astrological cause of complete hopelessness and all its ramifications for the financial markets.
Is the worst now behind us?
At Rosecast we track the position of the planets very carefully and we believe that a Grand Cross in the skies is a heavenly sign that the negative energy as expressed by the planets that form the Grand Cross has peaked.
On August 10 we have tracked a Grand Cross between Uranus (standing for disruption and revolution), Pluto (signifying in financial astrology big corporations and the whole banking system as well as debt), Mars (standing for war and violence in mundane astrology and for volatility in financial astrology) and Juno (asteroid # 3 that rules "fear and greed" and disillusion in financial astrology).
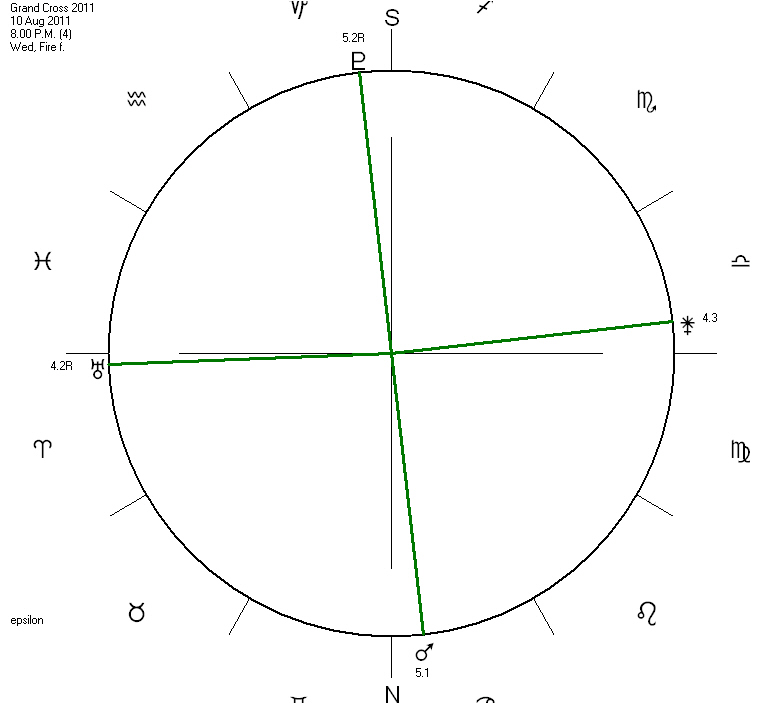
Moving Stars screenshot of position of planets forming Grand Cross on August 10, 2011. Time 8 pm, EDT.
Planets in clockwise direction:
Uranus is at 4.2 degrees Aries
Mars is at 5.1 degrees of Cancer.
Juno is at 4.3 degrees of Libra, note that asteroid #3 was believed to be a planet during the 19th century; it was first discovered in 1803.
Pluto is at 5.2 degrees of Capricorn, it was discovered in the year 1930 during the Great Depression.
As you see in the above /attached horoscope generated by our software Moving Stars - the best software for financial astrology available today - Pluto and Uranus are at 5.2 and 4.2 degrees of their signs respectively. In other words they are exactly 1 degree apart from completing a square aspect of 90 degrees.
But the exact opposition of Mars to Pluto and of Juno to Uranus on August 10 has created a bridge between Uranus and Pluto so that the disruptive energy could peak on this day.
At Rosecast we also believe that the riots in London and other parts of the UK have been caused by this energy of the Grand Cross.
Looking Ahead
The good news is that since August 8, 2011 Pluto and Uranus are separating again from each other. This should bring relief not only to the financial markets, but also to the streets of London . The good news is further that Pluto and Uranus will never be as close to a square again in this year as they have been during the period of July 29 to August 8, 2011. The bad news is that in the second quarter of 2012 Uranus and Pluto will move again towards each other - this time even into exact square.
Does this mean that the financial markets will crash again once the square becomes exact in 2012? No - you could not make such a statement by just looking at two planets. There are always a number of factors and planets to consider - but what I can tell you is that both 2012 and 2013 will be years of great volatility in the financial markets because of the squares between Uranus and Pluto. In the Rosecast Market Timing newsletter I do of course make more precise statements than this one. The key is to pinpoint the energy onto a certain day or a period of days by using several planets at the same time. Therefore a good financial astrology software like Moving Stars - see screenshot - that tracks the position of all important planets and asteroids - is my starting point for any of my financial astrology forecast. It can also be your starting point, if you are seriously interested in learning financial astrology.
With heavenly regards,
Markus Rose
In order to read this article online and find the horoscope of August 10, 2011 displayed visit www.rosecast.com/crash2011.htm
Markus Rose
http://www.rosecast.com
Ranked #1 Stock Market Timer
10/10/2007 to 10/10/2008 by Timer Digest
Ranked #1 Gold Timer of 2008 by Timer Digest