


WHAT ARE PLANETARY LINES?
Rosecast Planetary Lines - Plotting Planetary Movements onto Price Charts!
What are Planetary Lines?
Planetary lines are a graphical way to make the movements of the planets visible and can be plotted onto the price chart of any stock, commodity or currency pair. In a "Time and Price Matrix" the Y-axis represents the price-coordinate and the x-axis represent the time-coordinate. Astrologers should know that planetary lines can be compared to Graphic Ephemeredes that are part of many astrology software.
The difference between Graphic Ephemeredes and the Rosecast Indicators for Ninja-Trader is that with Rosecast you cannot only track the planets visually, but you also can add the price movement of any financial instrument onto the Planetary Ephemeredes. That way you can visually see how planetary movements influence the prices of stocks and commodities. Below I will show examples of Google, the S&P 500, the GBPUSD, and the US T-Bond, so that you can explore this important part of financial astrology.
WD Gann is known for the 45 degree angle.
How did WD Gann derive the 45 degree angle from the movements of the planets ?
From mathematics we know that a cycle has 360 degrees. Why has the cycle 360 degrees ? Because the cycle is a mathematical invention of the Babylonians in order to track the movement of the Sun and Moon and the visible planets - Venus, Mercury, Mars, Jupiter and Saturn. In the old times these planets were referred to as "Wandering Stars" or "Moving Stars" in order to differentiate them from the fixed stars on the firmament. Moving Stars is also the name of our astrology software that unites planetary geometry with modern astronomy.
The Babylonians noticed that the Sun moves approximately 1 degree per day, until it returns to the same place in the CIRCLE one year later...and hence they found it useful to divide the circle (among astrologers known as the Zodiac) into 360 degrees.
Astrology is the oldest of the sciences. Many inventions in Mathematics and Physics are a result of the observations of the planets. Mathematics and Physics would not have advanced so rapidly during the last three-hundred years without the human quest to understand our planets and their motions.
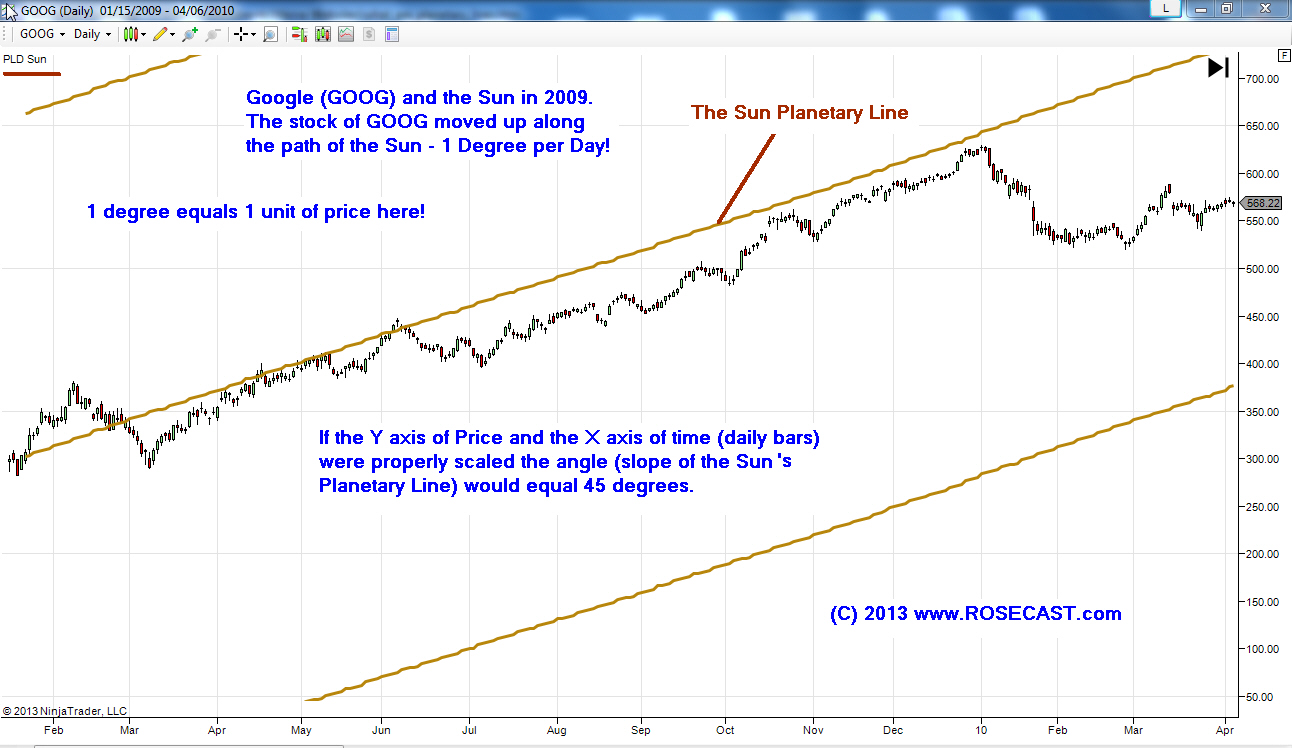
As the Sun moves 1 degree per day, we can equal 1 degree of the circle with 1 unit of price and we will arrive at the 45 degree angle. On a price and time chart a 45 degree angle will be visible, if the Y and the X axis are scaled according to the ratio: 1 unit of Y-axis (price, 1 US$) equals 1 unit of X-axis (time, 1 day).
Therefore the 45 degree angle is nothing more than the movement of our Sun plotted onto a price chart.
The example below demonstrates this and shows the relation between the Sun and the stock of Google.
WD Gann would not only chart the movement of the SUN, he would also track the other planets. Famous is a hand-made drawing that WD GANN has sent to one of his students showing the Mars Line plotted onto the price of Cotton.
WD Gann did his drawings per hand and hence it was obvious to him to equal the price and time axis in the ratio of 1 to 1. With today's computer software, such a ratio would not be practical for many stocks and hence the original angle of 45 degrees is not visible. But the advantage of our time is that we can plot all planetary lines onto a price chart in a few seconds by using templates.
See the example below: S&P 500, 2013
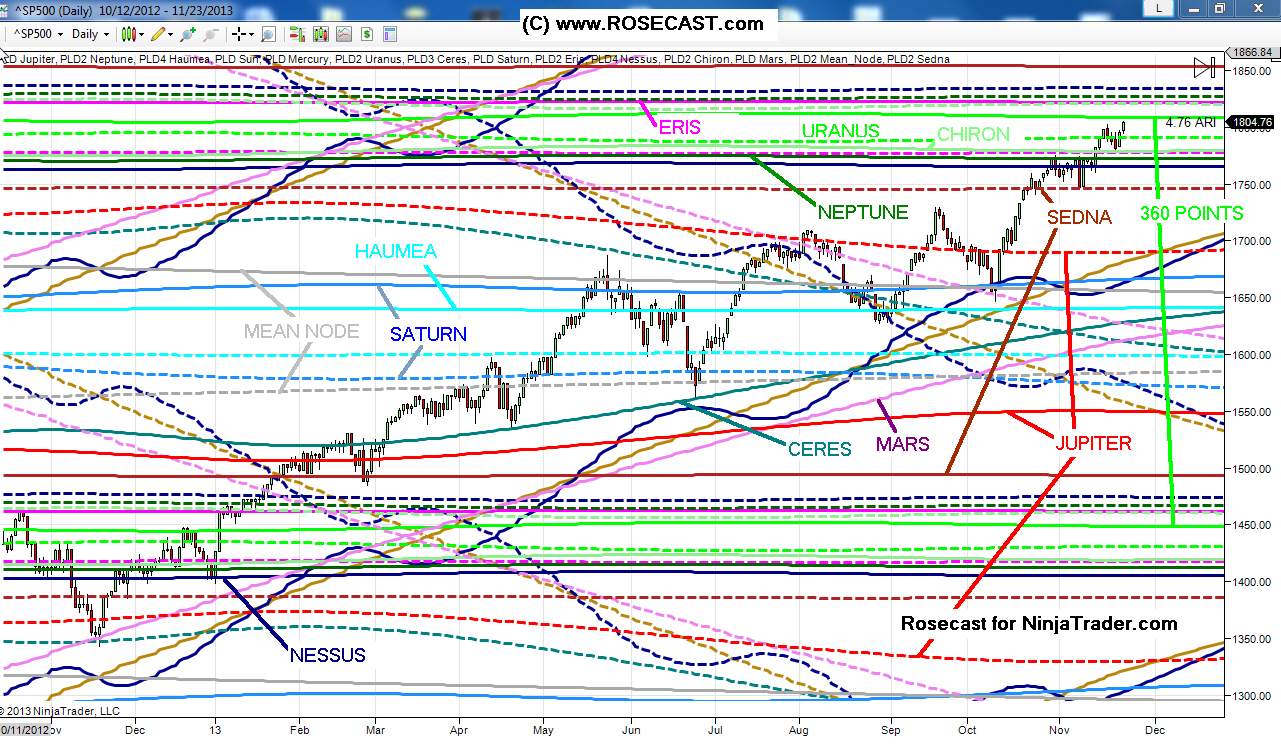
Each planet is assigned its own color: I.e. Uranus is Lime (Bright Green), Jupiter is Red and Saturn is Dodger Blue.
The "Solid Lines" present the actual positions as shown in a Graphic Ephemeredes. The "Dashed Lines" represent the lines of the Mirror Planets. Mirror Planets are mirrored across the Aries-Libra Axis (East-West Axis) according to the principle "as above, so below". The mathematical formula for this operation is: PL - 360 = ABS (PL MIRROR).
So why are the two Bright Green lines (solid and dashed) so close together ? Because Uranus is at 8 degrees (8 Aries) in the Zodiac. According to the above formula we get 352 degrees (22 Pisces) for Uranus Mirror.
Therefore the Uranus lines are only 16 S&P 500 points apart. 8 degree of Aries equals a price of 1808 for the S&P 500 (360 times 5 plus 8) and 22 Pisces equals 1792. Two solid lines of the same color are always 360 degrees apart in the above example. Why ? Because the circle has 360 degrees.
Notice that price usually reverses at a planetary lines. "Planets act as beacons on the board of the river of time and attract price". These are the words of George Bayer. WD Gann believed that traders subconsciously are attracted to prices at certain levels because of the magnetic attraction of planets.
Gann and Bayer also believed that astrology was the creation of God and both found numerous references to astrology in the Bible. If you are more interested in that I recommend reading "Bible Interpretations" by George Bayer or WD Gann's novel "Tunnel Thru the Air." Hence in this sense traders, banks, funds and hedge funds are indeed fulfilling divine law through their market operations. It is not possible to manipulate a market, not even for central banks, unless such manipulations are in accordance with the scientific law of vibration. Again this is what WD Gann believed.
The Rosecast Planetary Indicators are the most advanced tool currently offered to view these relations and are more advanced than any other software in this category, because they allow you to set both mathematical variables that determine the slope of any planetary line:
variable A - number of units of price in the circle -
variable B - the number of distance between two lines of the same color -
Therefore the Rosecast Planetary Line indicators represent an advancement in scientific astrology. Skeptics will say that planetary lines are completely random.
Here is my reply: It is well documented in ancient astrological literature that some planets are considered as beneficial in astrology (Jupiter and Venus) and others as malefic (Mars and Saturn and the North Node). If you look at many charts of various stocks and commodities, you will find that lows are often made at Saturn and the North Node and Highs at Jupiter or Venus. Also I am the only financial astrologer that has revealed to the astrological community in 2011 that Eris acts like Jupiter and hence planetary lines of Eris will often attract important highs across many stocks and commodities.
Sedna on the other hand will often create lows. If you look at the S&P 500 for many years back you will find that Jupiter, Venus and Eris are creating highs more frequently than Saturn, Mars, Sedna or the North Node. The latter planets on the other hand create lows more frequently. However, what is bad for one market, can be good for another market. All planets can create highs or lows, but I have found that the conjunction of two traditional malefic - Saturn and North Node - has created so many lows among so many different markets, that this heavenly SIGN is hard to ignore even for the biggest skeptics.
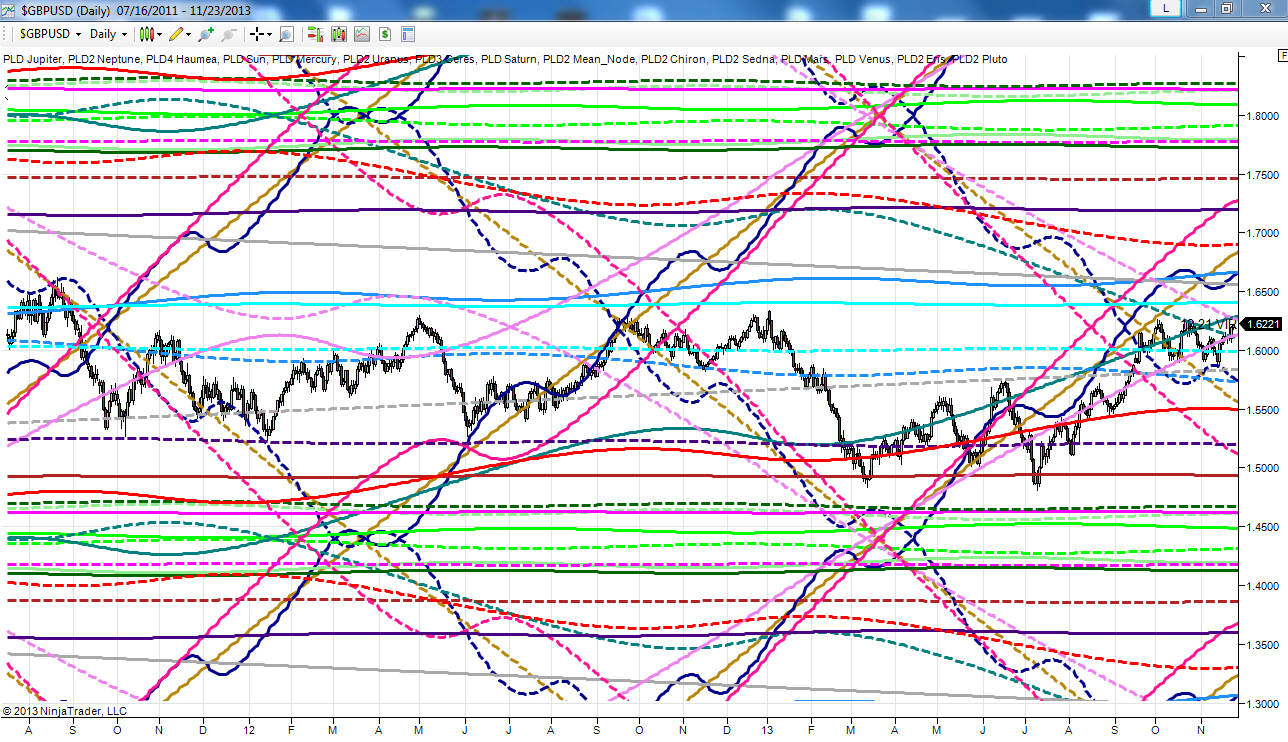
Below I show an example of the GBPUSD (Pound Sterling): Compare this chart below to the one of the S&P 500 above and notice the similarities between the arrangement of the colored lines (planets).
Notice how Sedna (color Brown - compare chart above for guide towards colors) has held the lows of the year 2013. The lows in 2012 were held by Pluto. The highs were held by Venus and the Sun.
And here is yet another example of the British Pound.
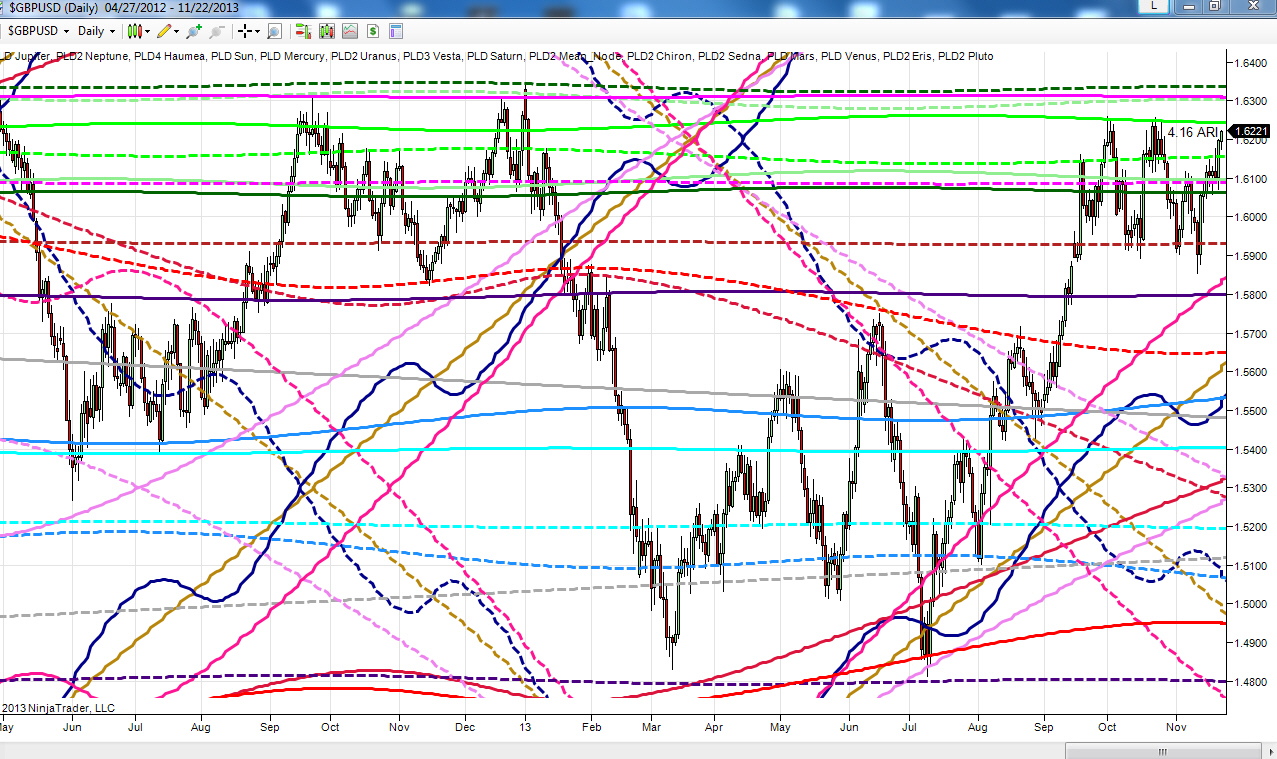
In this example (I have set the circle to 180 instead of 360 units of price) Eris (Magenta - Rose Line) has held the highs of 2012 and 2013, while Saturn, the Mean Node (April and May) and Mars (July 9)have held the low in 2013. Jupiter has held both highs and lows. It is a special property of the non-random magnetic attraction of the planets, that the same planet will often hold both the low AND the high. Just look at Jupiter (Red Line) in 2013 in the above examples.
Finally I want to include two more examples to drive home my point of non-randomness between market data and planetary lines. First look at the chart of the 30 year US T-Bond below:
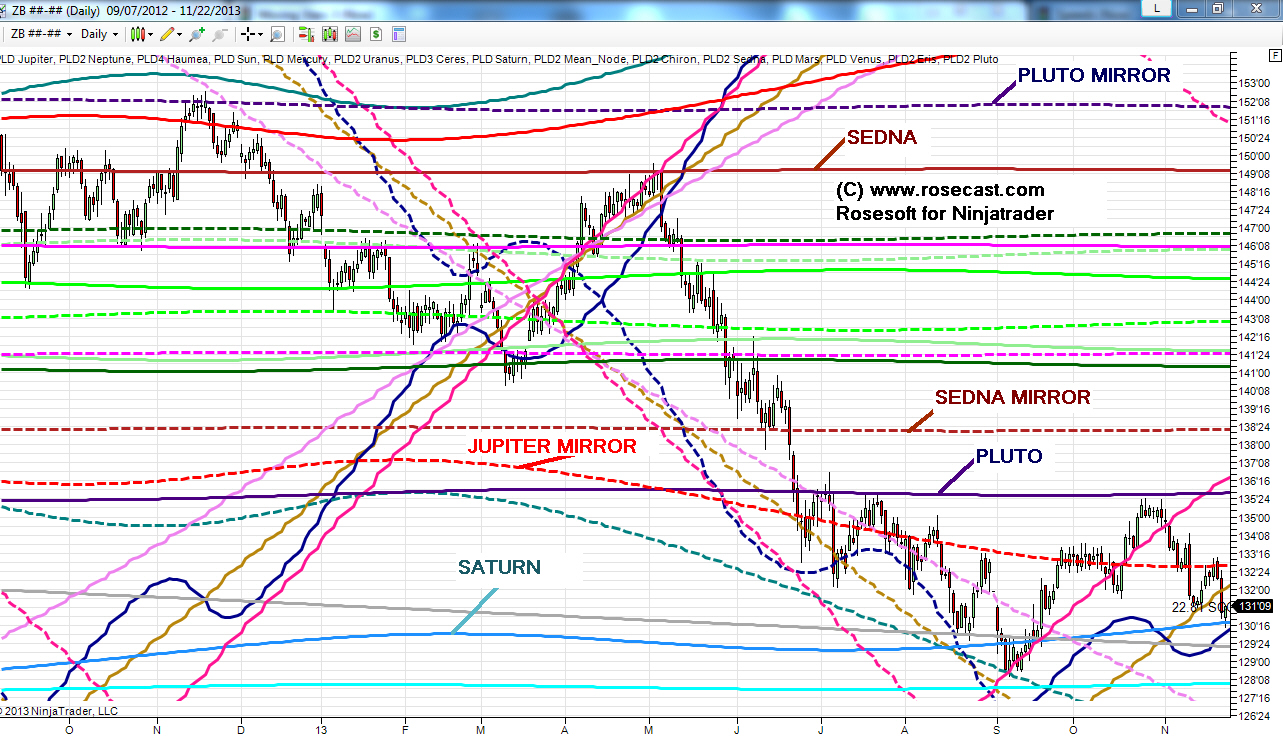
Sedna, Venus and Pluto have held the highs, while Saturn, the Mean Node and Venus are holding the lows.
Notice that the lows have come very recently on Saturn. Hence it is my forecast that Bonds are likely to trade up for the next weeks.
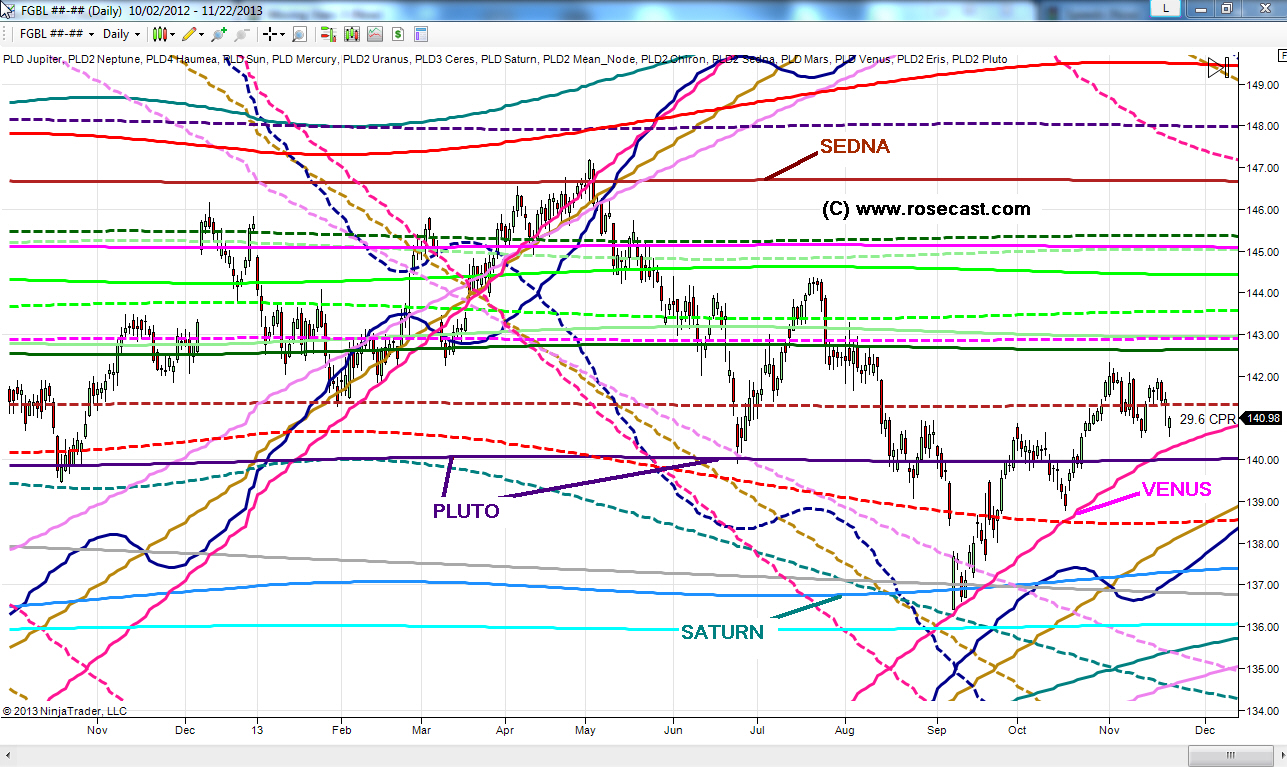
Finally I want to present you a chart of the German Bund. The lows in the German Bund came already in July. Still can you detect the similarities between the chart of the US Bond and the Bund ? Both markets have made highs at Sedna and lows at Saturn and Venus. However only the Rosecast Indicators are able to show these non-random correlations to you, because traditional Gann software does not allow to set the circle to any other number than 360 (pre-imposed factors of 2, 1, 0, -1,-2). In the example of the German Bund below, the circle is set to 180.
Summary: The Rosecast Planetary Line indicators are a scientific (mathematical) method of correlating price with time (planetary vibrations). They are unique as astrological indicators as they allow to chart the dwarfs planets Eris, Sedna, Haumea, Makemake, Sedna, Quaoar, Orcus, TC302 and 2007OR 10 (dubbed Snow-white by astronomer Mike Brown) in addition to well-known asteroids like Sappho, Eros and Nessus. Finally both variables that define any planetary line can be freely chosen. they represent a scientific leap in finding non-random correlations between planets and prices.
I also include a free PDF guide to the planetary line indicators that reveal the nuts and bolts as well as secrets of this methods, so that you completely understand how to use this tool.
While the Rosecast Planetary Line Indicators are not the ultimate proof of financial astrology, they come very close, as you will agree after reviewing this site.
With heavenly regards,
Markus
Markus Rose
http://www.rosecast.com
Ranked #1 Stock Market Timer
10/10/2007 to 10/10/2008 by Timer Digest
Ranked #1 Gold Timer of 2008 by Timer Digest