Bradley 2007
THE BRADLEY SIDEROGRAPH - THE MOST FAMOUS ASTROLOGICAL MARKET TIMING FORMULA - STILL GOING STRONG AFTER 60 YEARS
Rosecast.com is the leading financial astrology website for identifying the most accurate Bradley turning dates according to the original Bradley formula. In 1947 Donald Bradley has derived his unique formula by giving positive and negative values to certain planetary aspects and using the declinational movements of Venus and Mars.
In 2005 I have changed the Original Bradley formula to better account for my understanding of planetary geometry. The new formula I call the Rosecast Bradley.
Below you can view both the Bradley and the Rosecast Bradley for the past three years - 2004, 2005 and 2006 - and for the current year - 2007.
Thus the below website offers you to verify the accuracy of the Bradley and the Rosecast Bradley. In order to do so you have to compare the below charts to daily charts of stock market indices.
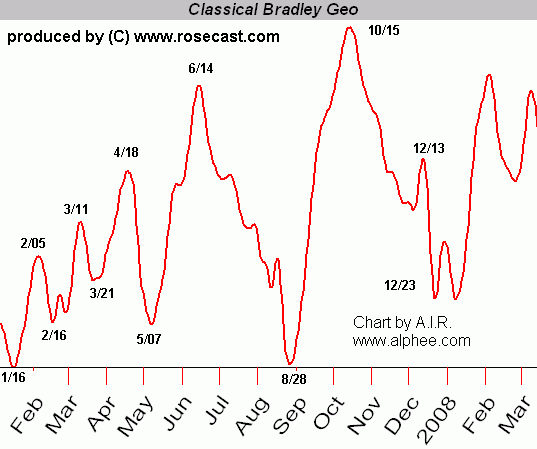
The Original Bradley Siderograph for 2007
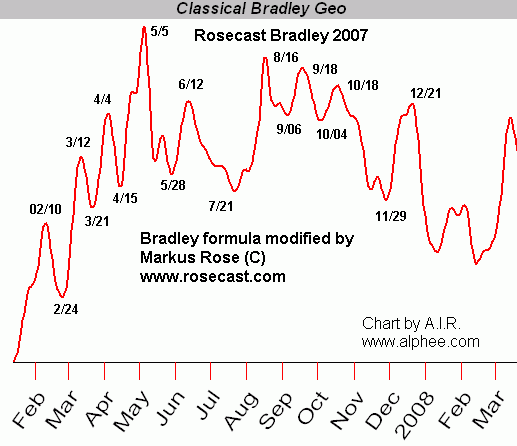
The Rosecast Bradley 2007
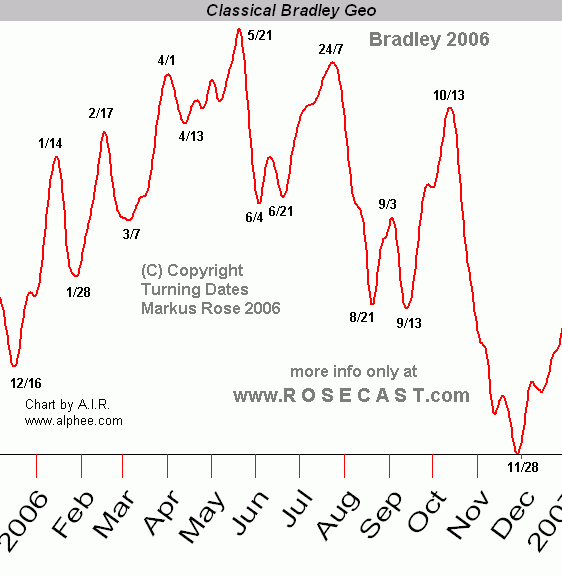
The Original Bradley 2006
The Rosecast Bradley 2006
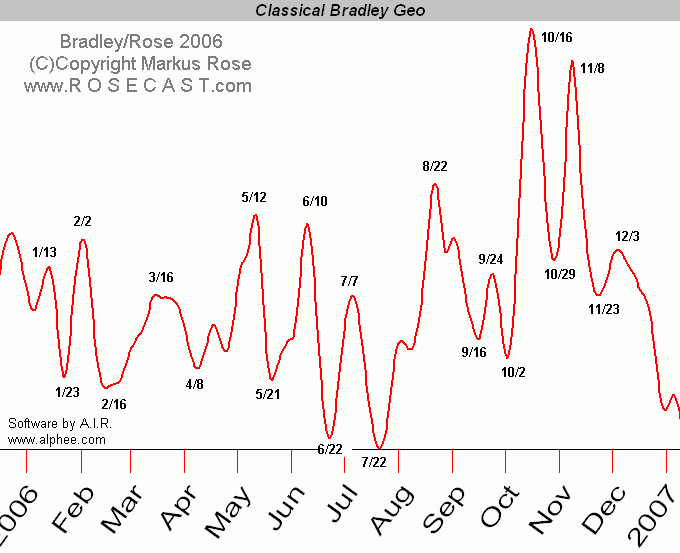
Above you can find the Bradley indicator for 2006 and 2007. As there is some interpreatation towards specifying an exact date (usually there is a range of three days in which the original formula can be interpreted to be exact), I have "copyrighted" the exact turning dates in the above chart that I have inserted manually in the software generated red curve.
However if you compare the Bradley Indicator here to the Bradley published by renowned financial astrologer Manfred Zimmel (www.amanita.at) you will discover that these two versions of the Bradley are approximately equal. And this should be the case as both are derived from the same formula whihc has been established by Donald Bradley already in 1947.
I
The Original Bradley 2005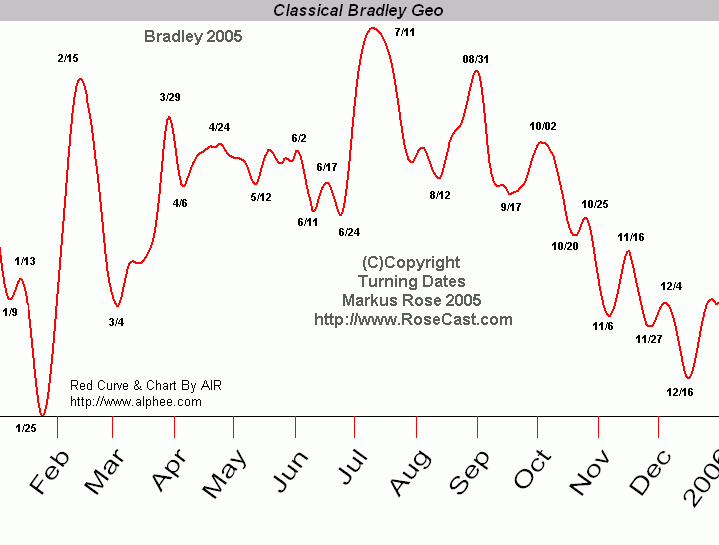
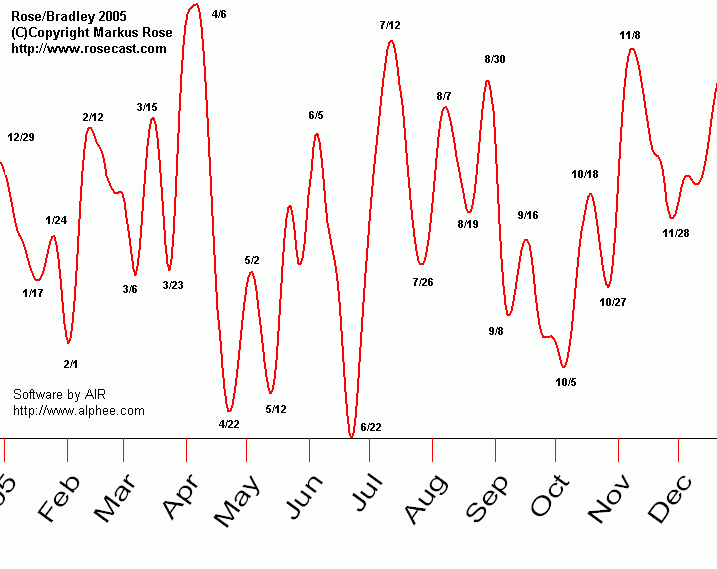
The Rosecast Bradley 2005
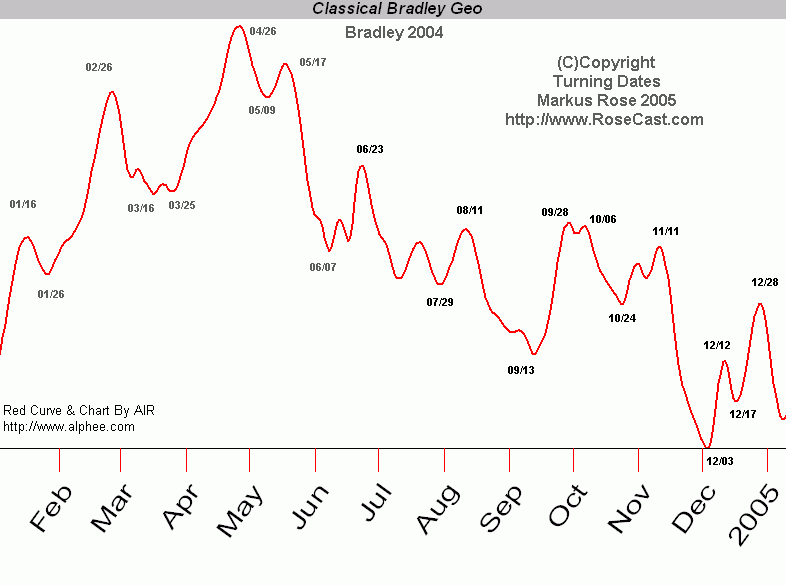
The Original Bradley 2004
The Rosecast Bradley 2004
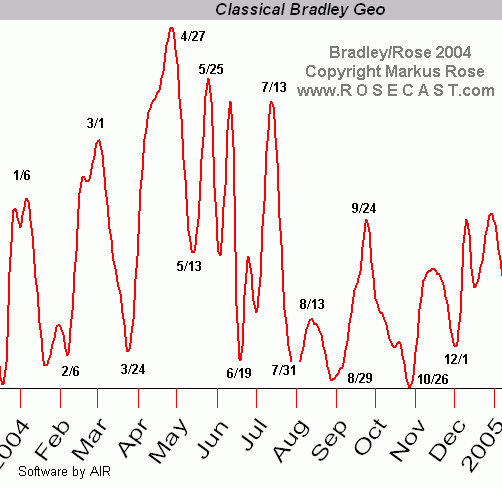
In 2004 17 out of the 21 turning dates indicated by the Original Bradley have coincided with important swing dates with an accuracy of 1 trading day plus or minus. This is a very remarkable result.
THE BRADELY SIDEROGRAPH IN ASTROLOGY REVISITED
(Original article of Markus Rose published in 2005)
Introduction
In the last free Rosecast newsletter (subscribe at www.rosecast.com) I have demonstrated that the financial astrology of two planets does not work. The reason is that the other planets will always issue their influence on a particular aspect of two planets. It is therefore methodically wrong to consider such aspects in a vacuum - pretending that the other planets are not around. Awareness is a crucial factor to success in trading. When using astrology in trading, one has to be aware of the whole picture that all planets provide.
However this is NOT new knowledge. In fact back in the 1940s a gentleman called Donald Bradley was of a similar opinion. And that is why in his book "Stock Market Prediction", he developed an indicator that would incorporate all planets and aspects into a single mathematical formula which he named the "Siderograph". Today the Siderograph is widely known as the Bradley Indicator or just "the Bradley".
The Bradley has a great record of forecasting turns in the stock market. Many respected market analysts who only have a remote understanding of astrology have given ample testimony to this fact.
If you don't take their words - just look at the last three turns as indicated by Bradley's Siderograph: December 27, 2004 (on this day the Dow Jones reached a high at 10868 followed by a 500 points decline), January 25/26, 2005 (the actual low in the Dow at 10368 came just one day earlier) and February 16, 2005 (this short-term high was followed by a sharp drop into February 22, 2005). By the way, the next turning points in the Bradley are March 4 and March 29, 2005.
Why is the Bradley so successful and widely followed after more than 50 years of being around ? Well you could certainly answer this question if you ONLY knew how the Bradley was calculated. And guess what ?
I am going to reveal to you how the Bradley Indicator is calculated and how Bradley derived his secret formula more than 50 years ago. When and where I am going to do this ?
Right HERE and NOW - in this free Rosecast newsletter.
BEHIND THE BRADLEY
Since Donald Bradley believed that all planets were able to influence the stock market - all planets entered his formula. These planets are the Sun (the Sun takes the place of planet Earth in geocentric astrology), Mercury, Venus, Mars, Jupiter, Saturn, Uranus, Neptune and Pluto - the nine planets in our solar system. Every child learns in high school about them - and if you remember high school - you will remember these planets - even if you do not know astrology.
In astrology the Moon is also regarded as a planet, but it was not part of the original Bradley formula. Bradley has also not included the North Node, another widely used factor in astrology today.
The asteroid Chiron is by many modern astrologers regarded as the "10th planet". Did Bradley include Chiron ? No he did not, because Chiron was first discovered by an astronomer in 1977 and Bradley created his indicator already in 1947.
36 Planetary Combinations and 5 Aspects
Bradley would then consider every relation that these nine planets were forming with each other - yielding a total of 36 (8 + 7 + 6 + 5 + 4 + 3 + 2 +1 =36) planetary combinations.
What is a relation between two planets ? In astronomy and astrology the planets are mapped on a circle of 360 degrees. If you divide this circle into equal parts you get harmonic divisions. I.e. a division of 4 yields 90 (360/4) degrees, a division of 3 yields 120 (360/3) degrees. Thus if two planets are either 90 or 120 degrees apart, they form a relation with each other. In astrology these relations are called "aspects".
Bradley employed the circle divisions of 1, 2, 3, 4 and 6 for his formula, leading to aspects of 360, 180, 120, 90 and 60 degrees respectively. Bradley did not include the division of 5 in his formula since the result 72 (360/5) is not a multiple of 10. In fact by choosing only these 5 aspects Bradley was in good company.
Already in the years 100 - 178 AD, Claudius Ptolomaeus of Alexandria was the foremost and respected astronomer of his time. He wrote a famous book called "Tetrabiblos" in which he summarized the astrological findings of the old Chaldeans and stated the importance of these five aspects. So it happened that up to this date - the five aspects that Bradley used in his formula - are known as the "Ptolemy" aspects.
Weighing 180 events as positive or negative
Combining 36 combinations with 5 aspects yields a total of 180 (5*36) planetary events that comprise the Bradley formula. For each of these Bradley would use a wide orb of 15 degrees, but he would assign the greatest weights to those planetary pairs that were making exact aspects to each other.
Simply spoken, if there are many planets making exact aspects at the same time - the Bradley Indicator will reach a peak and a turning point in the stock market is indicated.
This is however not exactly true. Building on the theory of the musical scale and on the old astrological scriptures of Ptolomaeus and other famous astrologers, Bradley would classify some aspects as positive and other aspects as negative. All 60 and 120 aspects received positive weights and all 90 and 180 aspects received negative weights. Concerning the remaining 36 conjunctions Bradley classified each of them individually as either positive or negative. All conjunctions formed by Mars and Saturn received negative weights, because Mars and Saturn were traditionally considered the malefic planets according to the ancient scriptures. Most of the conjunctions of Venus and Jupiter received positive weights since these two planets were the traditional beneficiaries. The remaining conjunctions Bradley rated as either positive or negative according to his testing of the stock market at that time.
Rising to Fame
By constantly weighing 182 (Bradley also added the declinations of Venus and Mars into his final formula) planetary combinations in that manner Bradley hoped that his Siderograph would turn positive as stock prices rise and turn negative as stock prices fall. After more than 50 years of data we know that his happened some of the time, but not most of the time. However the turns indicated in the Bradley formula have coincided with stock market turns in such a regular fashion and with such an amazing accuracy that the Bradley indicator has reached fame and widespread acclaim beyond the narrow borders of financial astrology.
THE BRADLEY IS A MEASURE OF PLANETARY GEOMETRY
Why does the Bradley work ? Because it is a mathematical and hence objective measure of planetary geometry. Let me explain this. The Bradley will reach a turning point if many of the 180 planetary aspects are becoming exact at the same time. I have convinced myself that neutralizing the effects of the Venus and Mars declinations will NOT change the turning points in the Bradley formula, although this will alter the SHAPE of the Siderograph.
Strictly spoken the Bradley will reach a high if many trines (120) and sextiles (60) and some conjunctions (0) become exact at the same time and will reach a low if many oppositions (180) and squares (90) and some conjunctions become exact at the same time. However many aspects becoming exact at the same time will always tend to create a special form of planetary geometry. And that is why the Bradley indicator is a mathematical measure of planetary geometry and the success of the Bradley proves that planetary geometry works in forecasting turns in the stock market.
Even if the Bradley has a great record of signaling long term stock market turns, at certain times it has failed completely to signal an important turn. Why ? Because sometimes the positive and negative weights in the Bradley formula will cancel each other out and the Bradley will NOT indicate a turn, even if the geometry of the planets would indicate otherwise.
I hope that you have gained some unique insides into the workings of the Bradley as I have had my reward from preparing the above. It was my objective to demonstrate that the Bradley is a purely astrological indicator and that it is based on an ancient branch of astrology that is best suited to forecast turns in the stock market and other financial markets.
(C) 2007, www.rosecast.com


