


THE ROSECAST BRADLEY IN 2009
May 7, 2009
ROSECAST FINANCIAL ASTROLOGY NEWSLETTER
In this Free Rosecast Newsletter I want to touch once again the topic of the Bradley Siderograph.
The Bradley Siderograph is the most famous astrological indicator for forecasting stock market prices with a forecasting history of over 60 years.
THE ORIGINAL BRADLEY SIDEROGRAPH VERSUS THE ROSECAST BRADLEY
Please find below the Bradley Siderograph for the year 2009:
chart 1:
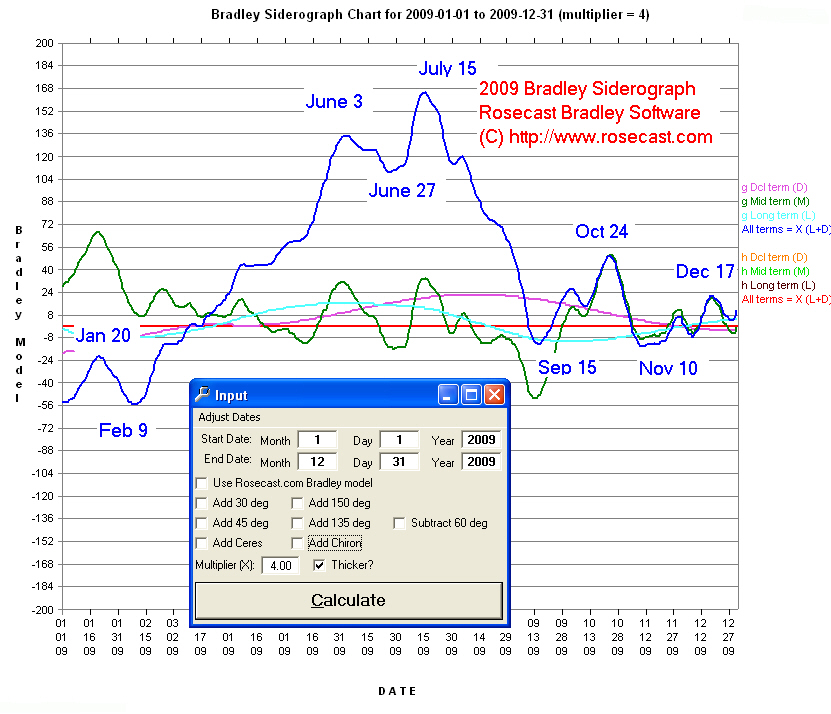
The above graph has been created with the Rosecast Bradley Software. If none of the checkboxes in the Input window are checked - as you can see above - then the Rosecast Bradley software will calculate the Original Bradley Siderograph as proposed by Donald Bradley in 1947.
In the last Rosecast Newsletter that was emailed to you in December of 2008, I have asked the following question:
Which is the more powerful Indicator - 1) the Bradley Siderograph that has indicated a strong turn for the period of December 12 to 16, 2008
(see the chart below - the red vertical line indicates the day of December 16, 2008 - find it in upper right hand corner)
chart 2: Bradley Siderograph for 2008-2009 with 30 and 150 degrees added / the December 16 turns appears also without the 30 and 150 degrees in the 2008 Bradley model.
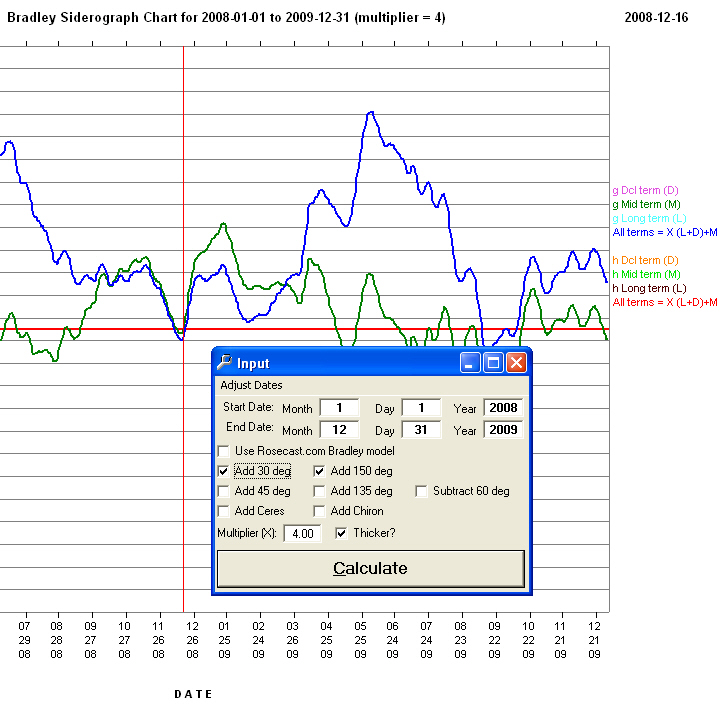
So which indicator is more powerful ?
In the end it turned out that both models have indicated an important top, the December 16 top in the case of the Bradley Siderograph and the January 6 top in the case of the Rosecast Bradley.
chart 4: S&P 500 Index
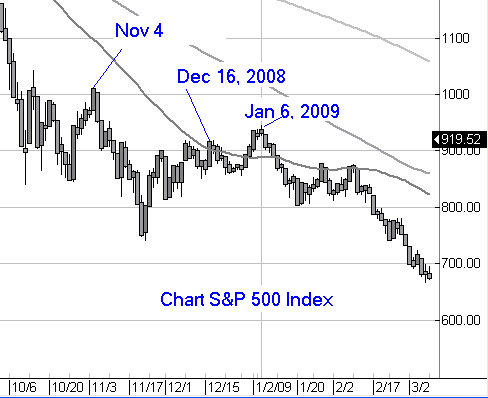
As you can see from the above S&P chart, this was a case where both Bradley models have inverted. If you had only one model at your disposal, the picture would not have been as clear, but with both models, once the second top was in, it was obvious that the market would head down for a longer time period as both Bradely model also indicated a turn for a longer time period.
Therefore my conclusion is that both models complement each other in an ideal way. Click here to see a chart of the Rosecast Bradley for 1987. The Rosecast Bradley has nailed both the August 1987 top and the December 4 bottom of the same year. The original Bradley has given the same indication for a top, but failed to nail the exact bottom. Only both models taken together have an uncanny history of spotting major turns in the stock market (and sometimes in other markets, too).
MODIFICATIONS OF THE ORIGINAL BRADLEY SIDEROGRAPH
Bradley has used the following five astrological aspects in his model: 00, 60, 90, 120 and 180. To each of these aspects he assigned an orb of 15 degrees. In the Bradley formula each aspect receives a higher value the more exact it becomes and a lower value the less exact it becomes.
In the Rosecast Bradley software I have added the important aspects of 30 degrees and 150 degrees and also gave them an orb of 15 degrees. Doing this I assured that all planets would be constantly in orb of one of the seven aspects. Thus with this addition I have created the perfect measure of planetary geometry in my opinion. Planetary geometry in this regard means the time when most of the planets in the nuight skies stand in a mathematical (aspect) relationship to each other.
Rosecast recommendation: Thus when using the Bradley I recommend you to first use its "pure" form and next to add both 30 and 150 degrees (with a simple mouse click) in order to achieve a perfect measure of the interrelationship of all planets at any moment in the skies.
One short notice about the term "all planets": The original Bradley uses the Sun, Mercury, Venus, Mars, Jupiter, Saturn, Uranus, Neptune and Pluto. In the Rosecast Bradley software I have created the possibility for the user to add Ceres and Chiron to the set of the original planets. However it is my experience that these additions will alter the bigger picture not significantly.Therefore I use these additions rarely. The additions of the 30 and 150 degree aspects are far more important in my opinion.
Finally I have created the possibility to add the aspects of 45 and 135 degrees to the Bradley formula. This addition will satisfy friends of the Hamburg school of astrology that places major weight on these two aspects. I have thus created an orb of only 7.5 degrees for all aspects when adding 45 or 135 degrees or both. The Bradley curve becomes therefore less smooth with these additions. To use the option of 45 and 135 degrees is less important in my opinion from the standpoint of planetary geometry (or from the standpoint of spotting major highs and lows), but could be helpful for someone that is particularly looking to buy lows in any market as the 45 and 135 degrees are traditionally associated with stressful planetary aspects.
THE ROSECAST BRADLEY SOFTWARE
The Rosecast Bradley software features all of the aboved described options and both the "Original Bradley" and the Rosecast Bradley. It has recently been improved so that it works now on all Windows versions smoothless, while previosly it would work only on English versions of Windows. At the same time a German language version of the software has been created for German speaking users (if you want to order the German speaking version, please specify upon ordering). Other language versions are considered and we are accepting distribution partners for non-English speaking countries.
The new version is called 1.23 while the old version was 1.13. Users of the old version (1.13) can upgrade for a fee of 19 USD to the new version. This upgrade fee is the same cost as an additional code key for the version 1.13.
THE ISSUE OF SOFTWARE COPY PROTECTION
After much soul searching I have come to the conclusion that I do not want to inhibit the freedom of rightful purchasers when using the software on their own computers. In today's time it is common that people buy a new computer every year or two. I myself hate to bother software companies for a license key when buying a new computer. Also it costs me additional time when setting up my new computer. I have therefore removed all hardware-related copy-protection features that would hinder the transfer from one computer to another. Thus the new version 1.23 will install - upon download - on all your present and future computers (just safe your copy on a disc and store it in a secure place). By the way, the software runs between the years 1800 and 2400, you can therefore even pass it rightfully onto your kids, if you do not longer use it. You are however not allowed to pass the software on to anybody outside of your family as this would breach your license agreement. Please refer your friends to Rosecast and we will consider this with a little surprise to you when they contact us with your name as a referral.
All currently available software from rosecast (ROSECAST TRADER and ROSECAST BRADEY) is now sold without special copy protection. I have discontinued MOVING STARS for the moment and plan on re-releasing it with an important improvement later this year.
THE NEXT FREE ROSECAST NEWSLETTER
In the next free Rosecast newsletter I will compare the period of the years 1929-1932 with the period of the years 2009-2012 and I will introduce a new piece of Rosecast financial astrology software in order to do so. It is my strong astrology-based conviction that the bear market that has started in October of 2007 has not ended on March 6, 2009 and the many Bradley charts I have posted in this free newsletter are just one indication of what is to come in the near future. But it is always worthwhile to look at the same subject from different angles. Therefore I am looking forward to the next Free Rosecast Newsletter which is scheduled to appear before May 21st.
Until then I remain with heavenly regards,
Your,
Markus Rose