


Bradley 2017
Dear Members and Friends of Rosecast,
Many people have been asking me, whether there is a simple model that can time the US stock market and S&P 500 Index.
For intraday-timing of ES futures, we have found a solution, it is called ROSECAST TIMER - for swing trading - I want to discuss again the popular Bradley Model.
The Bradley Model is still one of the most famous systematic applications of astronomical data to the Financial Markets.
Below I am comparing the Bradley Siderograph for the years 2016-2018 with the Rosecast Modification of the famous Bradley Model.
First, find the famous "1948 Bradley Formula", simply called "THE BRADLEY SIDEROGRAPH" below:
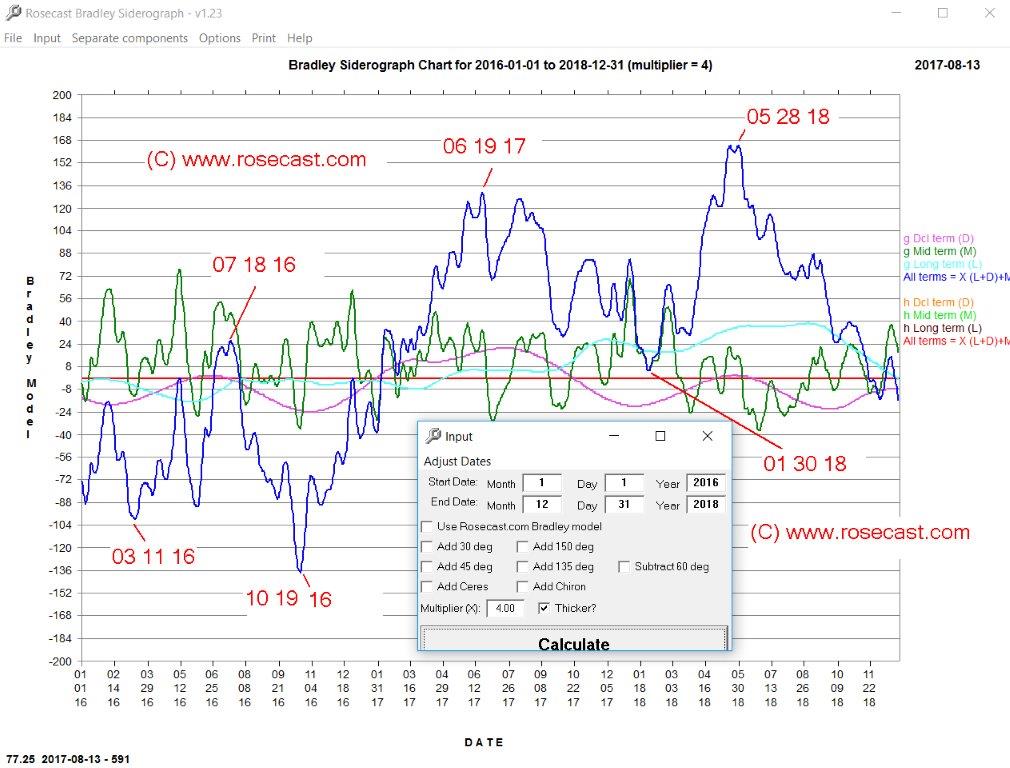
I have singled out in RED letters the SIX most important turn dates for the years 2016 - 2018.
When comparing the above Blue curve with the most six important turns in RED LETTERS to the S&P 500, only the June 19, 2017 turn date corresponded with a minor swing high in the S&P 500 Index.
Fans of the Bradley Model might argue that the great stock market advance after the US elections was predicted by the above model as the Blue curve was rising between October 19, 2016 and June 19, 2017 - yet the THE BRADLEY SIDEROGRAPH clearly failed to predict the exact lows and turning points, this is also true for the February 11, 2016 low.
Now let's compare the Famous Bradley Model above with the Rosecast.com Bradley Model - applying the modification of the original formula by Mark Rose, founder of Rosecast.com.
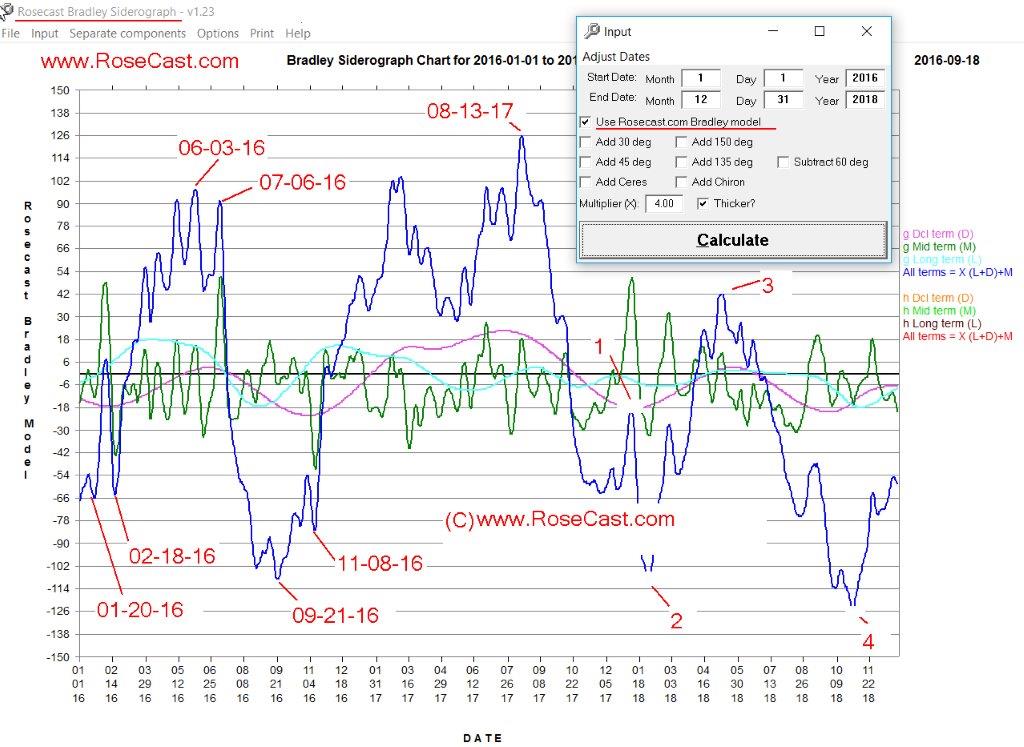
As you see, the Rosecast Bradley not only predicted the important January 20, 2016 low in Dow Jones, but was also closer to the most important February 11, 2016 low (February 18, 2016) when compared to the Bradley Siderograph. Furthermore, a significant low was recorded on Election Day - November 8, 2016. In fact between November 8, 2016 and February 23, 2017, the Rosecast Bradley Model recorded an increase of 180 points from - minus 78 points to plus 102 points. This was clearly the strongest increase in the three year period accounted for by the above graph.
In a nutshell, while the "Bradley Siderograph" has performed OK, the "Rosecast Bradley" has clearly outperformed the original formula.
This proves that greater results are possible when a knowledge man makes a small modification to the original formula.
Finally, note that the Rosecast Bradley recorded a strong decline between after July 6 / 7 - the very day when Bonds (and Yen and Gold) made significant highs in 2016.
Since Bradley has used all known planets (including Pluto) in 1948, there is no reason to assume that this model should apply to stocks only.
Many vendors sell software to calculate the Bradley Siderograph north of 220 USD. I have just seen one offer for 251 $ on the web.
Our software, not only gives you the Original Bradley Siderograph - and all its components - but EXCLUSIVELY - the "Rosecast Bradley" that outperformed the original formula during the last two years.
Talking about the year 2018, I have labeled the most important upcoming points as 1, 2, 3 and 4 - in the above software screenshot and you can see the approximate timing from the screenshot.
To get the exact dates, you can either purchase the Rosecast Bradley software from us at a special Cyber Monday holiday offer that runs until December 5, 2017 - or you can wait for the release of the 2017 yearbook.
Note that our software transfers all data into a CSV file, that also gives you the most accurate values for each day for the middle term (Green Line) and long term (Light Blue Lines).
ROSECAST BRADLEY SOFTWARE 125$ - "CYBER MONDAY" -SPECIAL OFFER - OFFER GOOD UNTIL DECEMBER 5