


THE ASTROLOGICAL REASONS FOR THE FLASH-CRASH OF MAY 6, 2010
MAY 6, 2010 - The DAY the Dow Jones has written history!
The astrological reasons for the "Flash Crash" can be found within the THREE DIMENSIONS of financial astrology!
Reading the article below will bring you special insights into financial astrology, that you will not find anyhwere else on the web!
All humans will make mistakes in their professions and financial forecasters are no exception. Forecasting every trading day can be quite demanding and sometimes the stars of those astrologers (this includes us at Rosecast) are not good.
Therefore wrong forecasts will occur from time to time. However those astrologers that have better knowlegde will naturally make fewer wrong forecasts than others. That is why WD Gann has said: "Before everything, get understanding." WD Gann has also advised in this context to refrain from trading, when the stars are stacked against you.
2) Now let`s turn to the second reason: Lack of Innovation.
In every profession progress is done through innovation. For example the TV in your home looks different than the one 30 years ago and a car looks different today than 30 years ago. But astrology is still done today in the same way as it was done 30 years ago.
We at Rosecast.com are innovators of astrology and that is why we produce our own software since the year 2005.
So here is the chart of the traditional astrology software Solar Fire Deluxe, the software that is used by many professional astrologers in the world, including myself. As it is not possible to chart Nessus and Pholus in Solar Fire by software default, I have placed them outside in a so called extra-ring wheel. As Solar Fire Deluxe does not provide for a glyph for neither Pholus or Nessus, so you see Pholus and Nessus written in letters and NOT displayed in glyphs.
The chart below is plotted for the time of the exact low in the Dow Jones, 2.46 pm, on May 6, 2010 TZ+4 for New York City.
Picture 1: Solar Fire Deluxe for 2.46 pm, May 6, 2010, TZ+4, New York City.
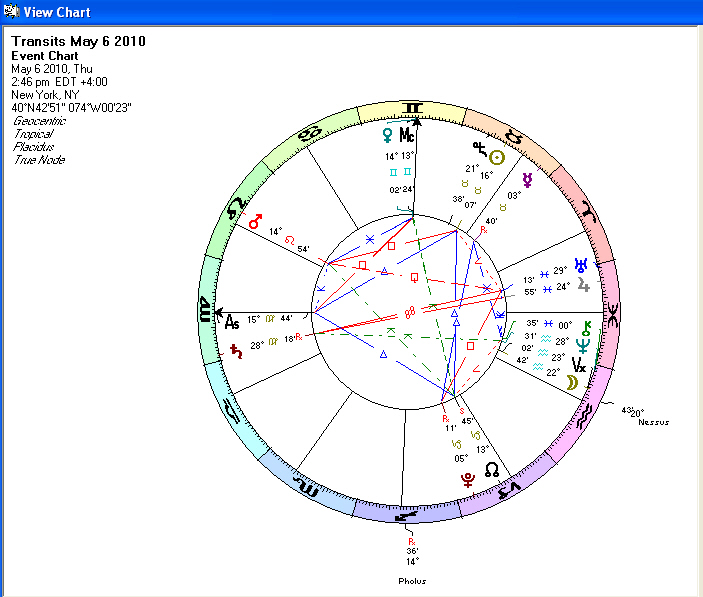
The violet, blue or red connecting lines between the planets we have added manually with a drawing software like Hypersnap or Paint Brush.
These lines are not part of the software, but we often draw these lines quickly in order to highlight the most important Aspects and Trispects on any particular day.
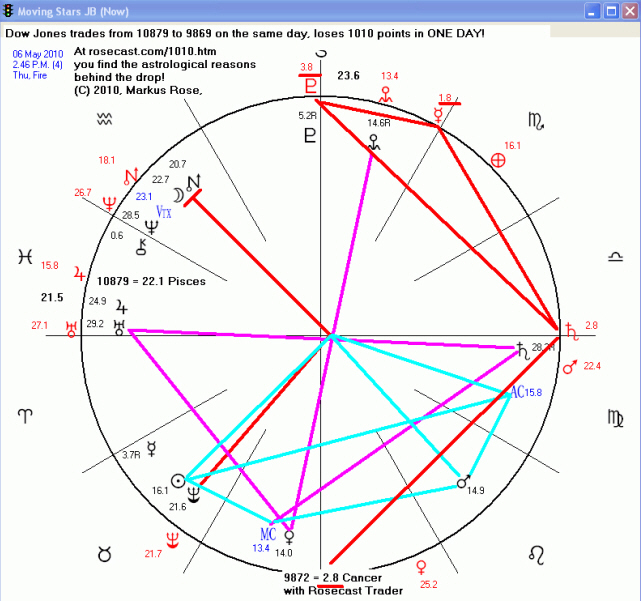
The chart below is plotted for the time of the exact low in the Dow Jones, 2.46 pm, May 6, 2010, TZ+4 for New York City.
Picture 2: Moving Stars for 2.46 pm, May 6, 2010, TZ+4, New York City.
The Three Dimensions of Financial Astrology
It seems hard to believe at first sight, but pictures 1 and 2 display exactly the same planetary information, the same planets, for the samy day, time zone and even the exact minute. Which picture do you prefer ?
The horoscope in picture 2 clearly shows which Aspects and Trispects are in operation on any PARTICULAR day (May 6) as opposed to the day BEFORE (May 5) and the day AFTER (May 7). In order to recognize the differences between the planetary positions on subsequent days we want to observe the exact planetary positions with one decimal accuracy in sufficiently large letters shown NEXT TO EACH PLANET as opposed to the standard format of minutes and degrees.The latter format is used by most astrologers today and can often hardly be recognized with the eyes. This gives astrology an occult touch. But while it is certainly occult, is it really practical, if minute positions are confused with degree positions, because both look very similar in a traditional astrological horoscope ? In our opinion the answer is "no". Also we think that astrology needs to be moved out of the realm of the occult in order to gain more fans among professionals within the financial and trading communities. Therefore we have designed Moving Stars differently from conventional astrology software.
In addition to what has been said above, MOVING STARS includes not only the geocentric planetary positions (planets as seen from the Earth) displayed in black color in the Inner Wheel of the horoscope, but also the heliocentric positions (planets as seen from the Sun) displayed in red color in the Outer wheel of the horoscope. It is my conviction that on May 6, the most plausible reasons for the strong drop in the Dow Jones were NOT found in the GOECENTRIC, but in the HELIOCENTRIC. Notice, that it is to this day not possible to show both the geocentric and the heliocentric charts in any piece of conventional astrology software at the same time. Only Moving Stars can accomplish this.
- As you can see Saturn stands at 2.8 Libra and Pluto stands at 3.8 Capricorn in the heliocentric chart. So these planets were only 1 degree apart from an exact square. Now if you followed my free newsletters since the year 2004, you will have learned that I do not give much weight to planetary aspects. One reason is that Saturn and Pluto were in similar positions for the whole week from May 3 to May 10 and not everyday the stock market did decline as much as on May 6. The market has only declined on those days when a dreadful opposition or square of Saturn was triggered by a fast moving planet in a Trispect and this fast moving planet pinpointed the square and opposition of Saturn to a particular day. On May 6, AT THE TIME OF THE LOW, it was heliocentric Mercury at 1.8 degrees that pinpointed the square aspect between Saturn and Pluto in a special Trispect (1.8 Mer + 3.8 Pluto / 2 = 2.8 Saturn) to that particular low time and LOW PRICE as we will demonstrate below.
Finally we have used our good & old software "Rosecast Trader" to translate the low price of 9872 at 14h46 pm in the Dow Jones Index to the astrological Zodiac.
Picture3: Screenshot of Rosecast Trader (Proprietary Software from Rosecast):
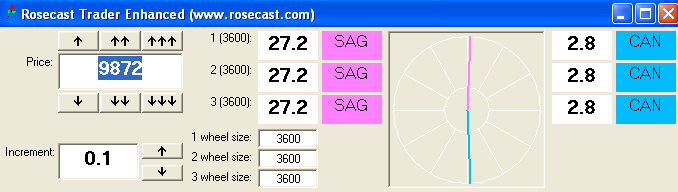
As you see 9872 translates to 2.8 Cancer using the Mirror of 27.2 SAG. This is is just a mathematical fact for any circle that is assigned the value of 3600 points. A circle has 360 degrees. But is the number 2.8 not familiar ?
Yes, it is. 2.8 Libra is the position of Saturn, the BEAR planet in the above described Trispect. And 90 degree is the typical bear aspect in financial astrology. 2.8 Libra is 90 degrees (the Bear Aspect) away from Saturn (the Bear Planet).
The chance is exactly 900 to 1 that the Dow Jones droppes to an exact square or opposition of Saturn in a 1000 point drop - and this has occured on a day when Saturn was the key planet of an exact Trispect with Pluto and Mercury.
But there is more: The extreme volatility that caused the Dow Jones to fall more than 1000 points was a reflection of two very rare planetary aspects that have fallen together on May 6, 2010 in order to form the pattern of a Quadspect (a constellation of four planets).
These rare planetary aspects were found in a dimension of astrology that is often wrongfully neglected by astrologers: Declination Declination measures the vertical distances of the planets from the Earth`s Equator. On May 6, both Jupiter and Saturn at 3.0 degrees and Mars and Pluto at 18.2 degrees were in contra-parralel declination at the same time. Mars and Pluto stand for extreme (Pluto) volatility (Mars) and Jupiter (the Bull) and Saturn (The Bear ) in contraparrallel aspect stands for the clash of bullish and bearish energies.
So there you have it. Both contra-parralel aspects were only exact on May 6 and not on May 5 and on May 7 or any other day in that year.
The point of this newsletter is to demonstrate the forecasting value of the three dimensions of astrology. These dimensions have been incorporated into our software programs "Rosecast Scientific" and "Moving Stars".
We have used the knowledge od the three dimensions to forecast GLORY DAYS, those days in the stock market, when the Dow Jones crashes more than 1%. We are proud to announce that we have forecasted a stronger than 1% crash for May 6, 2010 already on the evening of May 4, 2010. For a performance review of all of our GLORY DAY forecasts, click here.
Looking forward to connect,
with best regards,
Markus